Welcome to our October 24 Property Market Snapshot.
October at a glance
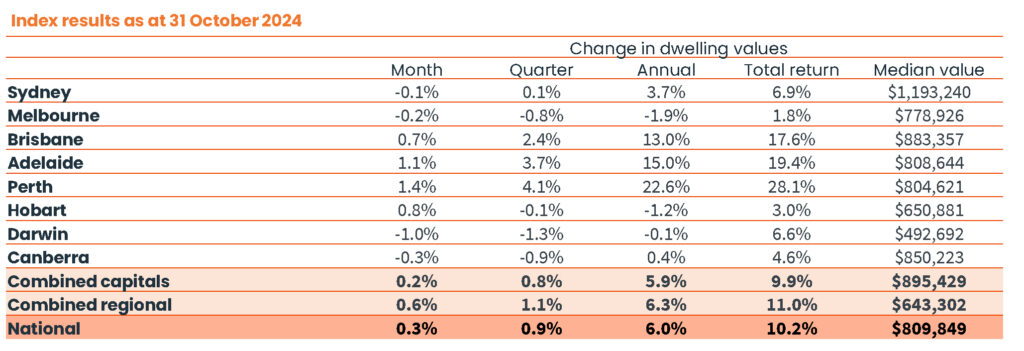
- In October, Home Values saw a 0.3% rise, marking the 21st month of growth since February last year.
- Mid-sized capitals reflected the slight positive movement, led by Perth showing a 1.4% rise over the month.
- This was offset by declines in Darwin (-1.0%), Canberra (-0.3%), Melbourne (-0.2%) and Sydney (-0.1%), as well as regional Victoria (-0.2%).
- Annual growth in national home values continued to ease, reducing to 6.0% over the 12 months ending October.
Dwelling values
Sydney home values declined for the first month since January 2023 with a -0.1 % fall. The weaker conditions have been led by the most expensive areas of the market. In the upper quartile of house values there was a 0.6% fall over October, and a -1.1% drop over the past quarter.
On the other end of the scale, Sydney’s lower quartile house and unit values both showed a half percent increase in values for October. This stronger performance across the more affordable end of the market could be seen across the capital cities.
Although the mid-sized capitals still lead the pace of value growth, they are also losing momentum.
A rise in advertised stock levels was seen alongside the slower growth in home values. Advertised inventory based on a rolling four week count of listings to October 27th, increased 12.7% across the combined capitals. The largest increase occurred in Perth where listings were 20.6% higher, albeit from a low base.
The number of home sales also appears to be fading. Capital city sales activity estimates over the three months ending October were down -7.5% from three months earlier and -1.6% lower than at the same time last year.
Selling conditions have loosened, with higher levels of advertised supply and less purchasing activity. Capital city auction clearance rates stayed below the 60% mark through the majority of October, meanwhile private treaty metrics are showing a subtle rise in median days on market.

Rental market
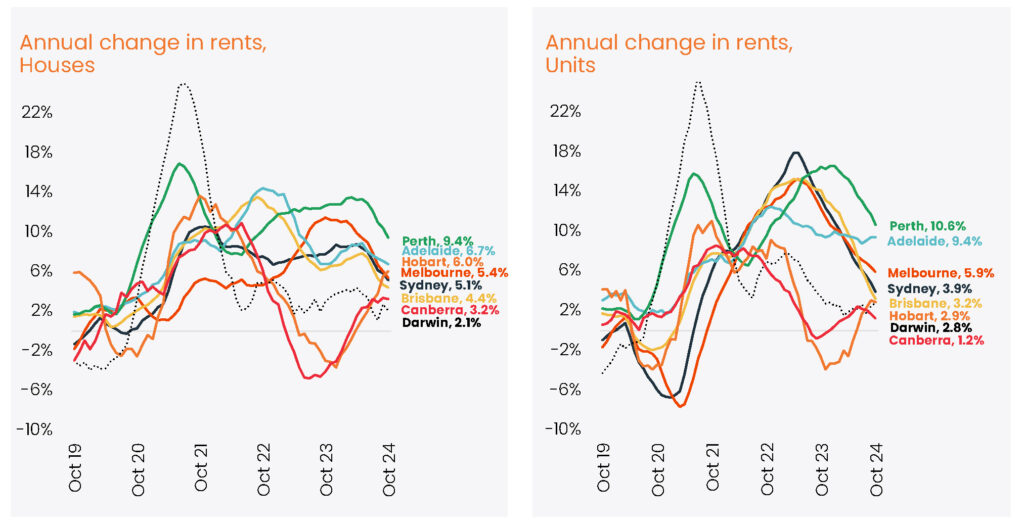
National rents saw a 0.2% rise in the month of October. This was a minor bounce back from the weaker growth over the previous 3 months. Rental growth has dropped to 5.8% annually, the smallest annual rise in the national rental index since the 12 months ensign April 2021.
Rents in the unit sector showed weaker trends, slowing rental growth. The unit markets of Sydney (-0.6%), Melbourne (-0.4%), Brisbane (-0.3%), Hobart (-0.6%) and Canberra (-1.5%) all slipped over the three months ending October 24.
As rental growth eases, gross rental yields are once again under some downwards pressure. The gross yield for all capital city dwellings was 3.47% in October, down from a recent high of 3.52% in May and a pre-pandemic decade average of 3.9%.
As growth eases in the rental market, gross rental yields are yet again under some downwards pressure. The gross yield for all capital city dwellings was 3.47% in October. This is down from a high of 3.52% in May and a pre-pandemic decade average of 3.9%.

Outlook
Between rising advertised stock levels, slowing purchasing activity and the loss of momentum in value growth, the housing outlook does appear to be a touch dimmer than it did a few months previously.
There is however, a trend towards lower inflation. This could mean a cut in interest rates in the first quarter of next year. Labour markets are also holding tight. The national unemployment rate has held at 4.1% over the last two months, due to solid jobs growth and record levels of workforce participation.
New housing supply continues to be low. Dwelling approvals have held below average, commencements have trended lower and the number of dwellings under construction has diminished.
While affordability challenges persist across most sectors of the Australian housing market, these factors ought to help to keep a floor under prices.
CLICK HERE TO DOWNLOAD THE FULL REPORT

Disclaimer: The opinions posted within this blog are those of the writer and do not necessarily reflect the views of Better Homes and Gardens® Real Estate, others employed by Better Homes and Gardens® Real Estate or the organisations with which the network is affiliated. The author takes full responsibility for his opinions and does not hold Better Homes and Gardens® Real Estate or any third party responsible for anything in the posted content. The author freely admits that his views may not be the same as those of his colleagues, or third parties associated with the Better Homes and Gardens® Real Estate network.


