Welcome to our August 23 Property Market Snapshot.
August at a glance
-
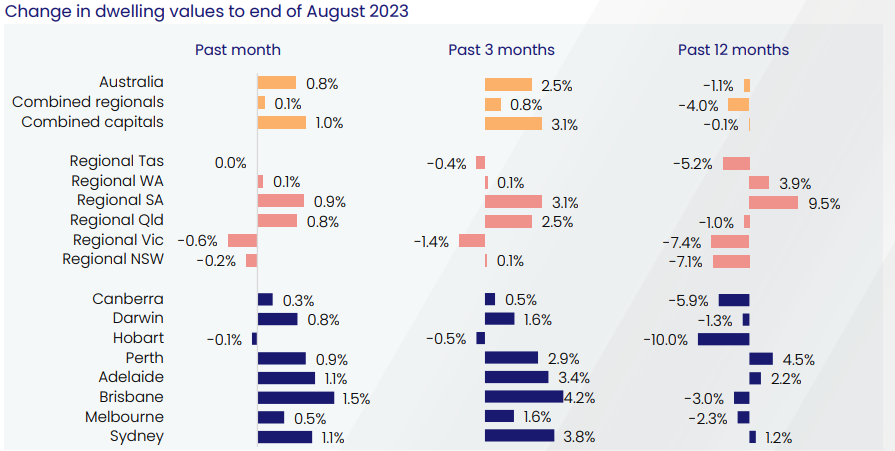
Dwelling values continued to rise, with the national Home Value Index (HVI) up 0.8% in August, marking six consecutive monthly increases and a 4.9% gain since February.
-
The housing market recovery is widespread, with most capital cities experiencing value increases in August, led by Brisbane (1.5%), Sydney, and Adelaide (both at 1.1%).
-
House values outpaced units nationally, rising by 6.3% since February, with Sydney showing a significant difference in recovery between houses and units.
-
In regional markets, conditions vary, with some areas seeing value declines and others showing modest gains, supported by lower advertised supply levels despite a seasonal rise in fresh listings.
-
The national rental index saw its 36th consecutive month of increases in August, with a 0.5% gain, albeit the smallest since November 2020.
Dwelling values
In August, the national Home Value Index (HVI) kept its upward trajectory intact, marking the sixth consecutive monthly increase at 0.8%. This uptick in monthly gains follows a brief two-month period of slowing capital growth. Since hitting its lowest point in February, the national HVI has surged by 4.9%, adding approximately $34,301 to the median dwelling value.
The recovery in the housing market has been widespread, with nearly every capital city witnessing a rise in dwelling values in August, except for Hobart, which saw a marginal decrease (-0.1%). The frontrunners in these gains were Brisbane (1.5%), followed by Sydney and Adelaide (both at 1.1%). However, it’s important to note that the housing market’s performance exhibits some variations; Sydney and Brisbane have displayed robust recoveries, while Hobart and the ACT have shown stability. This divergence could be attributed, in part, to higher advertised supply levels in the latter cities compared to the former.
In terms of property types, house values have shown a more pronounced recovery trend compared to units. Nationally, house values have increased by 6.3% since hitting the bottom in February, while unit values have risen by 4.9%. Sydney stands out in this regard, with a notable difference in the recovery rates between houses and units, possibly due to a more significant decline in house values (-15.0%) during the recent downturn.
 Source: CoreLogic Hedonic Home Value Index, 1 September 2023.
In regional housing markets, conditions have been mixed, with some areas experiencing declines in value while others recorded modest gains. These trends are influenced by various factors, including internal migration patterns and overseas migration levels. The housing market’s resilience is further supported by lower-than-average advertised supply levels, as new listings continue to be absorbed by the market, despite a seasonal increase in fresh stock. However, the delicate balance between advertised supply and demand will play a pivotal role in shaping housing market outcomes in the coming months.

Source: CoreLogic Hedonic Home Value Index, 1 September 2023.
Rental market
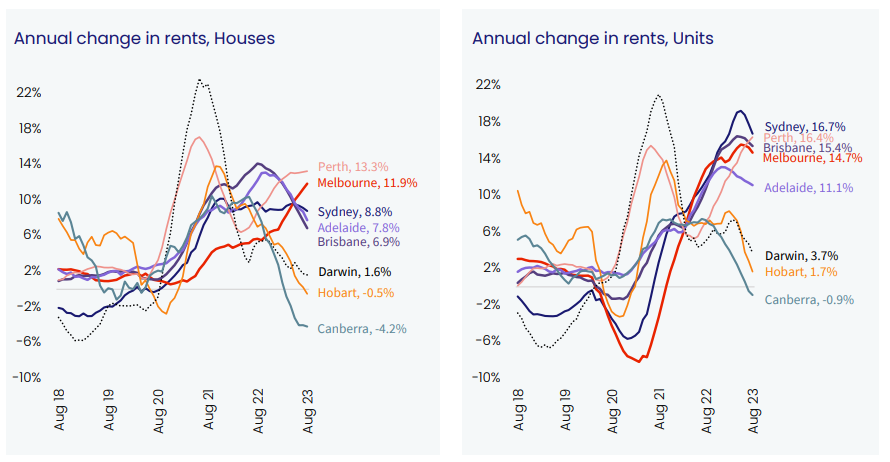
In August, the national rental index continued to rise, marking the 36th consecutive month of increases with a 0.5% gain. However, this was the smallest month-on-month increase since November 2020. Annual rents increased by 9.0% in August, the slowest annual growth rate since April 2022 but still significantly above the decade average of 3.2%.
While rental growth slowed in many areas, some exceptions, like Melbourne houses and Perth units, saw record high annual growth rates. Despite tightening vacancy rates, rental growth has decelerated. Every capital city saw a reduction in total rental listings over the past month, highlighting supply concerns. Gross rental yields have been declining since April, reaching 3.82% in August, suggesting a potential peak in yields due to factors like higher debt costs and increased taxes.

Source: CoreLogic Hedonic Home Value Index, 1 September 2023.
Outlook
The Australian housing market is showing signs of resilience and continued growth. While there is diversity in performance across different regions, with some areas experiencing a decline in home values, the overall trend is positive.
One key factor to watch in the coming months is the rise in total property listings. The recent increase in listings has contributed to a deceleration in value growth. Historically, the spring and early summer months have been more active for property listings, so the upcoming spring selling season is likely to see increased market activity.
However, several challenges remain. Access to the housing market remains challenging for many buyers, particularly in terms of credit availability. Borrowers are required to demonstrate their ability to repay loans at mortgage rates significantly higher than current rates, which can be a barrier for some.
Consumer sentiment also plays a crucial role, and until there is a substantial improvement in consumer confidence, a significant rise in active home buyers may be unlikely. With interest rates expected to remain steady until well into 2024, some households may face mortgage stress as they transition from low fixed home loan rates to higher refinanced rates.
Strong population growth continues to drive housing demand, and there is yet to be a significant supply response. Net overseas migration is projected to remain above average, further underpinning housing demand, especially as dwelling approvals continue to lag.
In summary, while the housing market faces challenges, there are also factors supporting its growth. The interplay between these factors will shape the housing market’s trajectory in the near future.
CLICK HERE TO DOWNLOAD THE FULL REPORT
Disclaimer: The opinions posted within this blog are those of the writer and do not necessarily reflect the views of Better Homes and Gardens® Real Estate, others employed by Better Homes and Gardens® Real Estate or the organisations with which the network is affiliated. The author takes full responsibility for his opinions and does not hold Better Homes and Gardens® Real Estate or any third party responsible for anything in the posted content. The author freely admits that his views may not be the same as those of his colleagues, or third parties associated with the Better Homes and Gardens® Real Estate network.


