January at a glance
- National dwelling values dropped by a further 1.0% in the first month of 2023,
- The largest declines again in the cities of Hobart (-1.7%) and Brisbane (-1.4%),
- Every city record a drop in house values in January,
- There were 16,770 new listings over the 4 weeks ending 29 January which is 22% lower than the same time last year,
- National rent prices increased by 0.7% over January, marginally higher than the previous month.
Housing values
The value of property in Australia declined by 1.0% in January, continuing where is left off in 2022. The trend was evident across the country with no capital city able to hold its value. The greatest declines were recorded in Hobart and Brisbane where values were down -1.7% and -1.4% respectively.
 Source: CoreLogic Hedonic Home Value Index, 1 February 2023.
The latest change sees the median value of property in Sydney fall to below one million which has not been the case for quite some time. The median value of property is $999,278 in Sydney, $746,468 in Melbourne, $698,204 in Brisbane, $646,045 in Adelaide, and $559,971 in Perth. While this is good news for first home buyers, it does not necessarily mean buyers have the power as limited stock means there remains limited choice and therefore not as much opportunity to bargain.
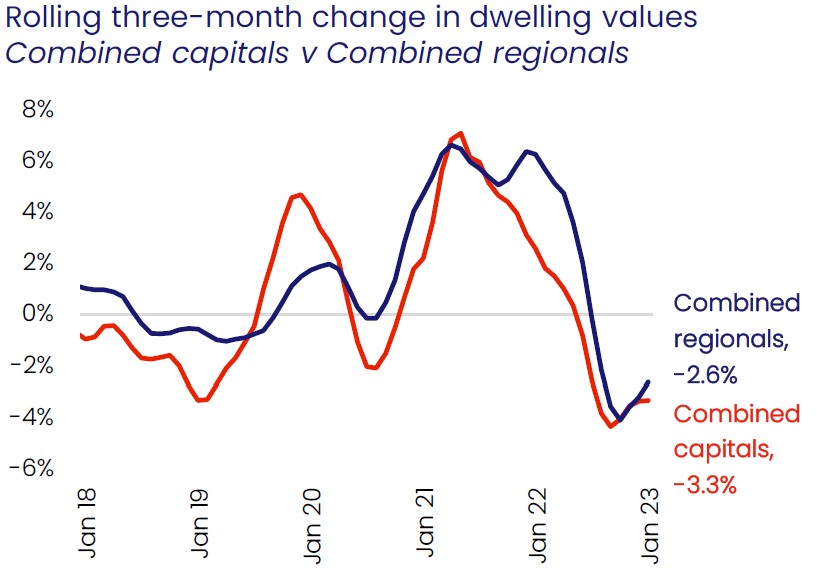
The graph below depicts the steep decline in housing value growth since its peak in early 2021. It also shows that while median prices have been falling each month, the size of the decline has tapered in recent months. The most noticeable easing of values has been recorded in the premium markets where the more expensive properties have seen sharper declines (but also benefited from the sharper increases when prices were on the rise).

Source: CoreLogic Hedonic Home Value Index, 1 February 2023.
Inventory remains low
The volume of new property advertised for sale continues to be low which reflects a reluctance from those who might be considering selling from testing the market. There were 16,770 new listings in the 4 weeks ending 29 January 2023 which is 22% lower than this time last year. Total advertised properties are also lower than the same time last year, and 24% below the 5 year average.
This low level of inventory means buyers are somewhat limited in the stock they can purchase, a factor that has assisted house prices not falling more than they otherwise could have in an environment where interest rates have increased continuously since May last year.
Rental market
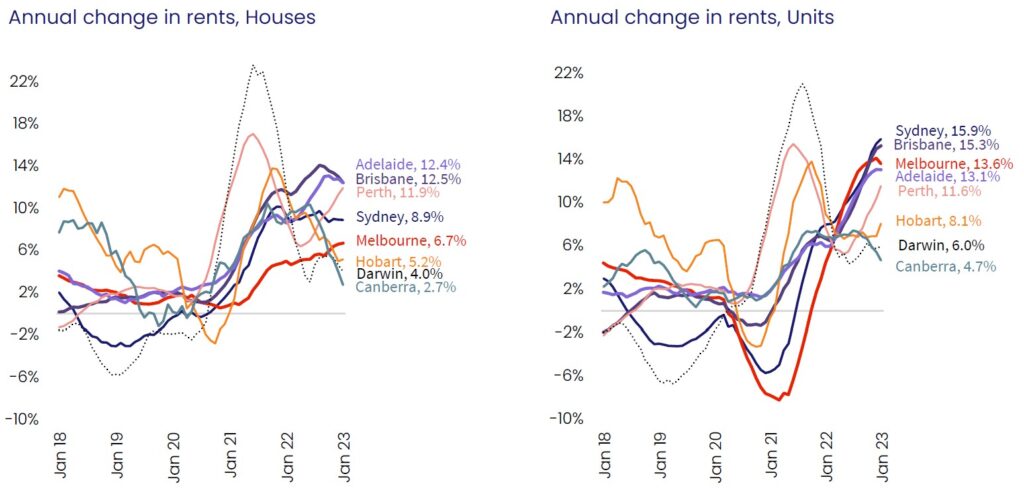
National rents increased by 0.7% in the month of January, up from 0.6% in the previous month. The annual change in rent has exceeded 10% in many capital cities across houses and units.
The graph below shows annual rental values for houses grew by 12.5% in Brisbane, 12.4% in Adelaide, and 11.9% on Perth. When looking at unit rental prices of the last year, Sydney saw values increase by 15.9%, Brisbane 15.3%, Melbourne 13.6%, Adelaide 13.1 and Perth 11.6%.
The strong demand remains in place and has been driven by a limited supply of rental properties as well as overseas migration. On recently, the Chinese Government announced it would not recognise university studies completed online by Chinese students at foreign universities which may see 40,000 students potentially returning to Australia to continue their study. This will further add fuel to a hot rental market as tenants compete for the limited availability of rental stock close to universities, particularly in Sydney and Melbourne.
Source: CoreLogic Hedonic Home Value Index, 1 February 2023.
Outlook
The Reserve Bank again in it’s February meeting decided to increase the official cash rate a further 0.25% with very strong hints that there will be more in order to contain inflation. With home owners cautious about listing in the current market, it is likely that house prices will likely continue to see marginal declines and soon plateau. Property owners who have made solid capital gains since the onset of COVID may opt to sell now and take advantage of the limited inventory of homes for sale and bank most of their gains
CLICK HERE TO DOWNLOAD THE FULL REPORT
Author: Frank Knez
Disclaimer: The opinions posted within this blog are those of the writer and do not necessarily reflect the views of Better Homes and Gardens® Real Estate, others employed by Better Homes and Gardens® Real Estate or the organisations with which the network is affiliated. The author takes full responsibility for his opinions and does not hold Better Homes and Gardens® Real Estate or any third party responsible for anything in the posted content. The author freely admits that his views may not be the same as those of his colleagues, or third parties associated with the Better Homes and Gardens® Real Estate network.


